Learning Goals
By the end of this section you will:
be able to develop Entity Relationship Diagrams by:
identifying the entities in a data scenario
categorizing attributes under the entities
establishing the relationships between the entities
resolving many-to-many relationships
identifying foreign keys
be able to develop a Relational Schema from the Entity Relationship Diagram
use sample table to check the Relational Schema
The purpose of the ERD and Relational Schemas are to design and represent the database that forms your application’s datastore (model).
The first step in designing a database is developing an understanding of the scenario. For learning about designing databases we will use the following scenario:
EDR — Entity Relationship Diagram
An Entity Relationship Diagram (ERD) is a type of flowchart that illustrates how “entities” such as people, objects or concepts relate to each other within a system.
lucidchart_2017_er
In following the process of creating a ERD, you will create a relational database that complies with normalisation rules to the level of 3NF.
Watch the videos below to understand designing an ERD.
Entity Relationship Diagram (ERD) Tutorial - Part 1 Summary
What is an ERD?
A visual representation of a database structure showing entities, their attributes, and relationships.
Helps developers understand how data elements interact.
Why Use ERDs?
To organise data clearly and logically.
Useful for systems like Twitter usernames or Amazon’s inventory and order management.
Core Components:
Entities: Objects being tracked (e.g., Customer, Order, Product).
Attributes: Properties of entities (e.g., Customer ID, Name, Address).
Relationships: Connections between entities (e.g., a Customer places an Order).
Cardinality: Defines the numeric relationship (e.g., one-to-many, zero-to-many).
Cardinality Examples:
A customer can have zero or many orders.
An order must have one and only one customer.
An order can include many products, but a product can belong to zero or many orders.
Notation Used:
Crow’s foot notation for visualising cardinality.
Entity Relationship Diagram (ERD) Tutorial - Part 1 Summary
Primary Keys (PK)
A primary key uniquely identifies each record in a table.
Must be:
Unique
Never-null
Never-changing
Example:
Customer IDis a better PK than name or address because it’s stable and unique.PKs prevent duplication and maintain data integrity.
Foreign Keys (FK)
A foreign key is a reference to a primary key in another table.
Used to define relationships between tables.
Example:
Customer IDin the Order table is a FK referring to the Customer table.FKs can be repeated (unlike PKs) and there can be multiple FKs in one table.
Composite Primary Keys
A composite key uses two or more fields together to uniquely identify a record.
Useful when no single field is unique (e.g.
Order Number+Product IDfor a Shipment table).Rules:
Use as few attributes as possible.
Avoid changle fields.
Bridge Tables
Used to resolve many-to-many relationships.
Stores interaction data between two entities.
Example: An Order table can serve as a bridge between Customers and Products.
Ensures more detail like time, quantity, and frequency of purchases.
Data Types
You can add data types to attributes in your ERD for clarity and database design:
INTfor IDsVARCHAR(n)for text fields (e.g. names, phone numbers)
Helps prepare ERDs for database implementation.
We will use the following steps to create our Entity Relationship Diagrams, using the Student Subject Database as an example:
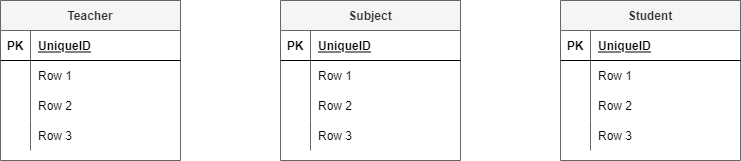
Step 1: Identify the entities
Look at the scenario and the data needs and identify all the entities that the database needs to store. Entities can be people, places, things or processes.
In the Student Subject Database we have the following entities.
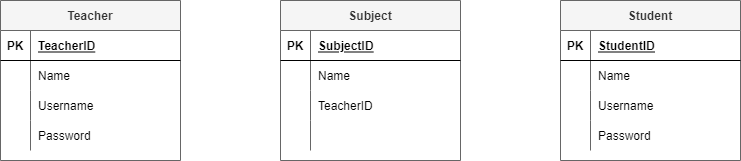
Step 2: Add attributes
Refer back to your data needs and requirements and add the relevant attributes to each entity.
The Student Subject Database ERD after stage 2:
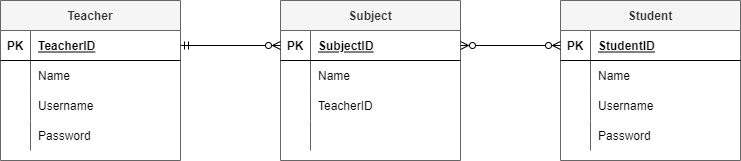
Step 3: Establish relationships and cardinality
The next step is to create the relationship between the entities:
Connect the related entities using lines.
Establish the cardinality by working out the range of connections each entity can have to the second entity.
Cardinality options

For example in the Student Subject Database:
teacher—subject relationship
each teacher can teach zero to many subjects (assuming you can have teachers who do not teach for this time period)
each subject has one and only one teacher who teaches it
student—subject relationship
each student can study zero to many subject (assuming a student can be enrolled but not studying)
each subject can have zero to many students studying it (assuming a subject can exist without students studying it)
You will end up with the following ERD
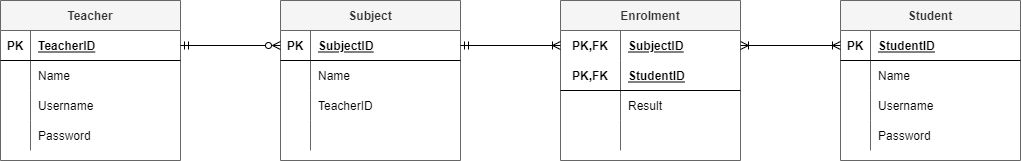
Step 4: Resolve many-to-many relationships
In this course we will use bridging entities to deal with many-to-many relationships.
To do this:
find a many-to-many relationship
place a bridging entity between the two entities
the bridging entity will have a composite key, consisting of the primary keys of the two original entities.
reconnect the relationships
establish the new cardinality
the cardinality will be a many on the bridging entity’s side, and a one on the original entities’ sides
enter the primary keys from the original entities as the two parts of the composite key for the bridging entity
add any other relevant attributes
For our Student Subject Database:
the subject—student relationship is a many-to-many
add a bridging entity between the two, and named ‘Enrolments’
if you can’t think of an appropriate name, just combine the name of the two original entities
connect the relationships from the Enrolments entity to the Subject entity and the Student entity
the new cardinalities will be many on the Enrolments entity end, and one on both the Subject entity and the Student entity
SubjectID and StudentID are entered as the two parts of Enrolments’ composite key
the attribute of Results is added to Enrolments
At the end of step 4 our ERD looks like this:
Step 5: Identify the foreign keys
Identifying the foreign keys establishes how the different entities are connected together. If there is a relationship drawn between entities, then there must be a primary key—foreign key connection.
Steps to establish foreign keys
select a relationship
check the table on the many end
look for a attribute that logically connects it to the other entity
ensure that the name of the foreign key reflects the primary key of the connected entity
note: if you can’t find one, you should add an attribute and name it after the primary key of the connected entity
place a FK in front of the foreign key attribute
move the relationship so that it connects the foreign key to the primary key in the connected entity
Our Student Subject Database example at the end of step 5:
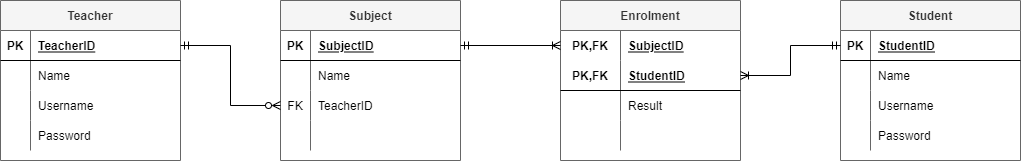
Relational Schema
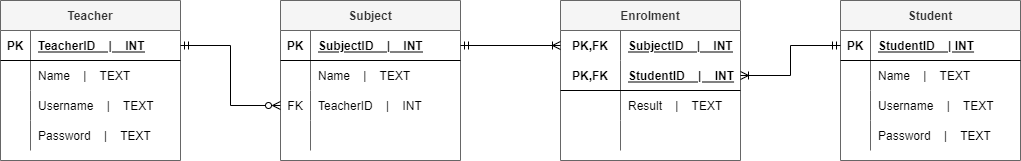
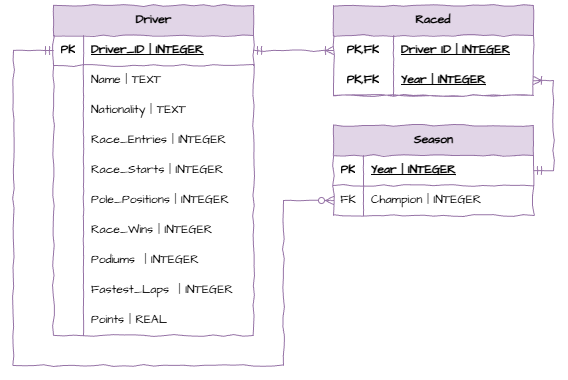
To convert your final ERD to a Relational Schema (RS) you will need to identify the datatype of each field.
We will be using SQLite which provides the following data type options:
INTEGER: signed integers
REAL: floating point values
TEXT: text strings
BLOB: a blob of data, stored exactly as it was input
Since Diagram.net does not provide a three column entity table, we will separate the attribute name and data type using the | symbol.
The RS for the Student Subject Database will look like:
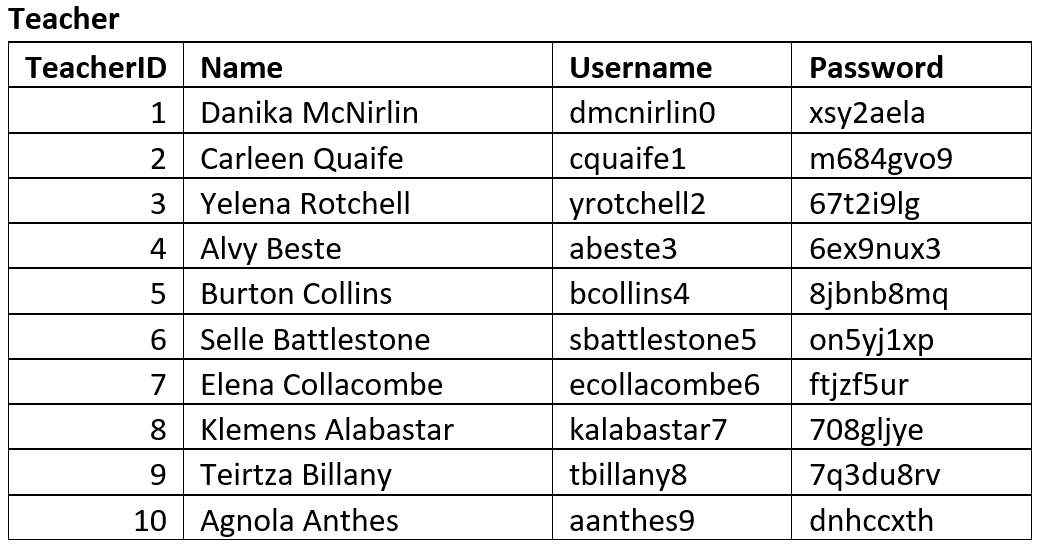
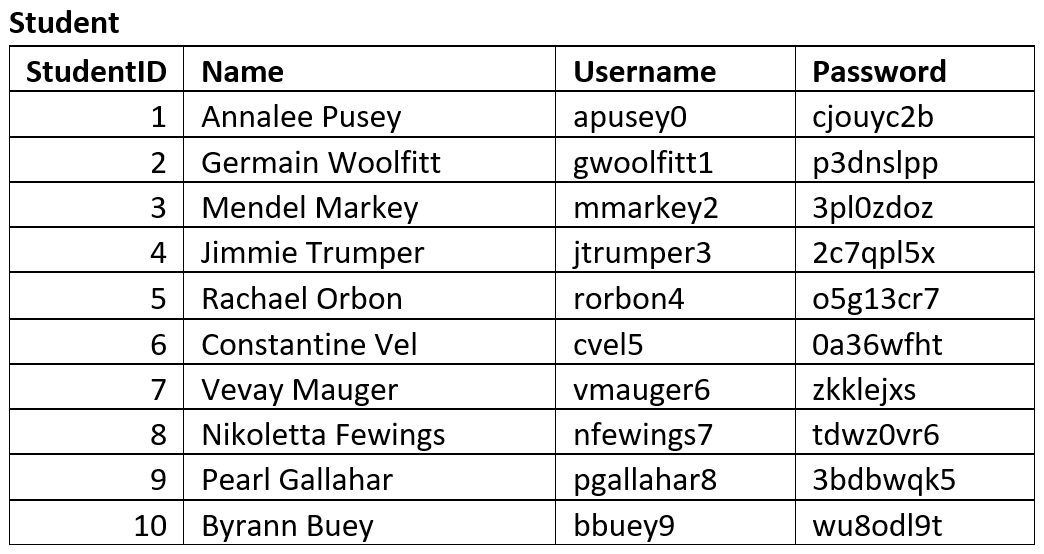
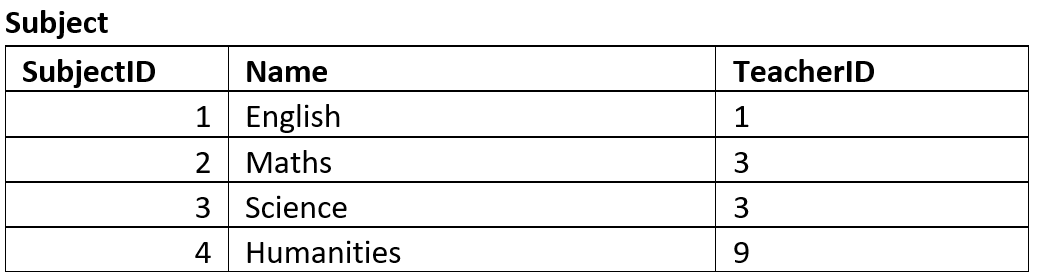
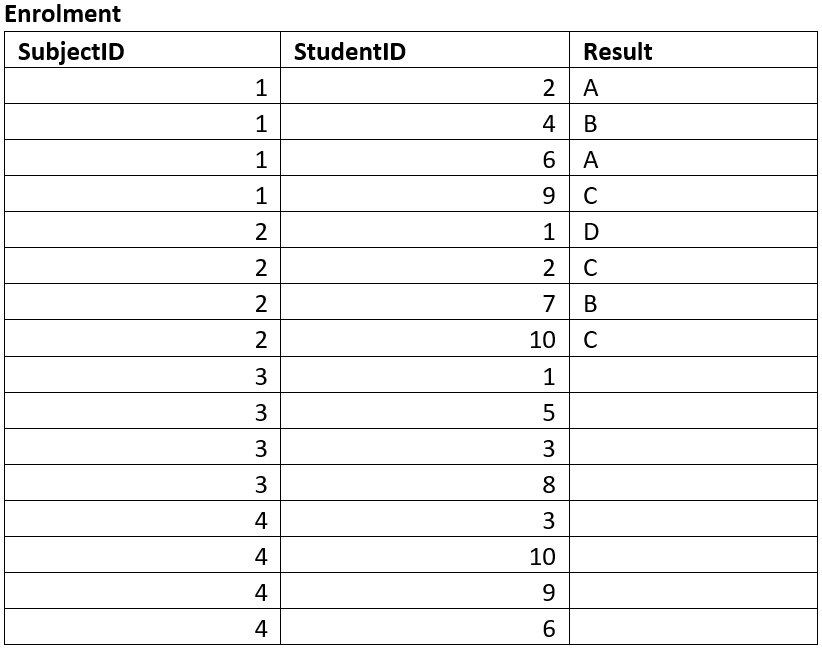
Sample Tables
Sample tables are used to ensure that the database structure that the ERD produced can effectively store the required data adequately.
You should create tables that reflects the entities identified and attributes identified by the ERD. Then fill the table with sample data. This data may be given to you, or you may produce mock data that is representative of data that will be stored in the database. A good resource for creating mock data is mockaroo.
Below are the sample tables for the Student Subject Database.
ERD & RS Activities
Activity 1
A manufacturing company produces products. The following product information is stored: product name, product ID and quantity on hand. These products are made up of many components. Each component can be supplied by one or more suppliers. The following component information is kept: component ID, name, description, suppliers who supply them, and products in which they are used. Represent this information in a relational schema.
Acvitity 2
Create a relational schema for a school library that allows students to borrow books throughout the term. Each book has a title, a genre, and the year it was published. Students can borrow multiple books, and each borrowing event includes a borrow date and a return date. The library also keeps track of who wrote each book, including the author’s name and nationality. Authors may have written multiple books.
Activity 3
An online store allows customers to place orders through a website. Each customer provides a name, email, and phone number when registering. Orders include the date placed and the total cost. Each order contains multiple products. Every product has a name, a price, and an amount in stock. For each product in an order, the system tracks the quantity purchased and the selling price at the time of order. Create a relational schema representing this data.
Activity 4
A company keeps its order records in a spreadsheet where each row lists the customer name, their address, the items purchased, the unit price of the items, and the order date (see table below). The company wants to convert this into a structured database. Create a Relational Schema for this database, then create sample tables using the data from the original table.
| Customer Name | Address | Item | Unit Price | Order Date |
|---|---|---|---|---|
| Alice Johnson | 123 Park Lane | Keyboard | 49.99 | 2024-06-01 |
| Alice Johnson | 123 Park Lane | Mouse | 19.99 | 2024-06-01 |
| Bob Smith | 456 River Rd | Monitor | 149.99 | 2024-06-02 |
| Bob Smith | 456 River Rd | Keyboard | 49.99 | 2024-06-02 |
| Charlie Lee | 789 Forest Ave | Mouse | 19.99 | 2024-06-03 |
| Charlie Lee | 789 Forest Ave | Webcam | 89.99 | 2024-06-03 |
| Alice Johnson | 123 Park Lane | Webcam | 89.99 | 2024-06-04 |
| Diana Prince | 321 Ocean Dr | Monitor | 149.99 | 2024-06-04 |
| Diana Prince | 321 Ocean Dr | Mouse | 19.99 | 2024-06-04 |
| Evan Thomas | 654 Mountain Rd | Keyboard | 49.99 | 2024-06-05 |
| Evan Thomas | 654 Mountain Rd | Webcam | 89.99 | 2024-06-05 |
| Fiona Chen | 987 Valley St | Mouse | 19.99 | 2024-06-06 |
| Fiona Chen | 987 Valley St | Keyboard | 49.99 | 2024-06-06 |
| George Hill | 147 Sunset Blvd | Monitor | 149.99 | 2024-06-07 |
| George Hill | 147 Sunset Blvd | Mouse | 19.99 | 2024-06-07 |
| Hannah Black | 369 Seaside Ln | Webcam | 89.99 | 2024-06-08 |
| Hannah Black | 369 Seaside Ln | Keyboard | 49.99 | 2024-06-08 |
| Ian White | 753 Skyline Ave | Monitor | 149.99 | 2024-06-09 |
| Ian White | 753 Skyline Ave | Webcam | 89.99 | 2024-06-09 |
| Jessica Green | 159 Pine Way | Mouse | 19.99 | 2024-06-10 |
ERD from Data Files
For Unit 3 you will need to analyse data files to create a relational schema. We will now look at how to analyse a data file and create a relational schema from it.
We will be using cvs files as our datafile. It is importnat to note that csv file can only represnet flat files, while we will be working with relational databases. Therefore, we will need to decompose the data in the csv file into multiple tables.
Before we do this it will be useful to remember the rules of Normalization.
A table is in 3NF if:
Each column contains atomic values
Each column contains the same type of data
Each column and row has a unique identifier
The order in which the data is saved does not matter
There are no partial dependencies
There are no transitive dependencies
You will need...
While we can look at the raw csv file as a datafile, it is easier to analyse if we open it in Excel or similar software.
View csv file in Excel
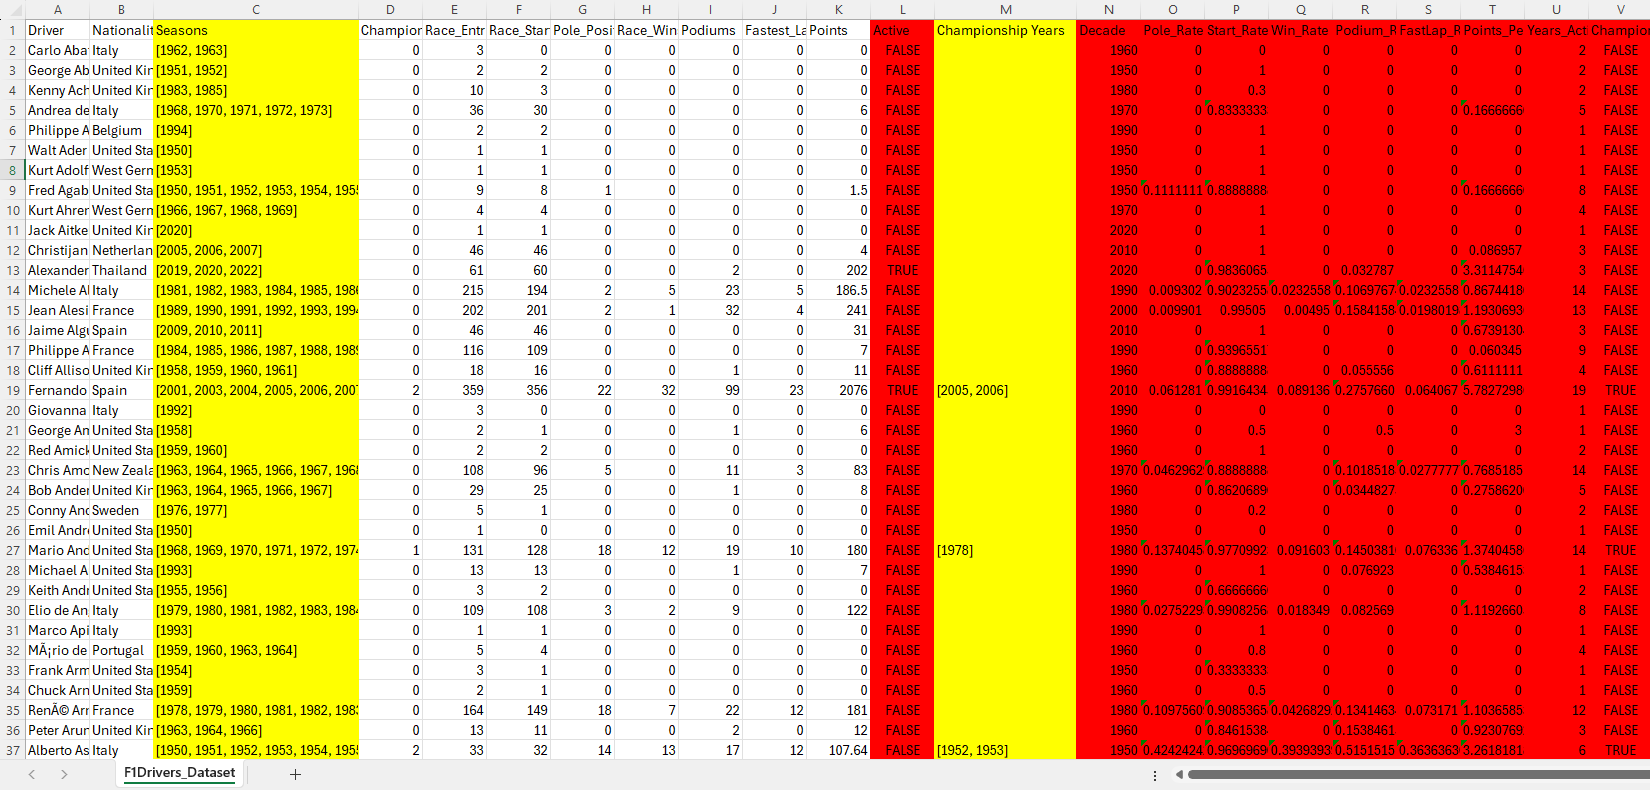
Navigate to the data folder in the unit repository and open the file F1Driver_Dataset.csv in Excel.
The first thing Excel will want to do is convert the data in the file. Do want to see the data as it is, so select Don’t Convert, then get rid of the yellow banner warning of dataloss, by click on the x on the right.
Since the table is almost 900 records long, we want a way to easily look over all the data. Fortunately Excel has a feature called Filters that will help us with this.
To turn filters on:
Go to the Data tab in the ribbon
Click on Filter
You should now see little arrows next to each column header. Clicking on these will allow you to see all the unique values in that column, and filter the data based on these values.
Non-atomic values
The first thing we will do is to check that each column only contains atomic values.
You will notice that both the Seasons and the Champioship Years columns contain multiple values in a single cell, therefore non-atomic values.
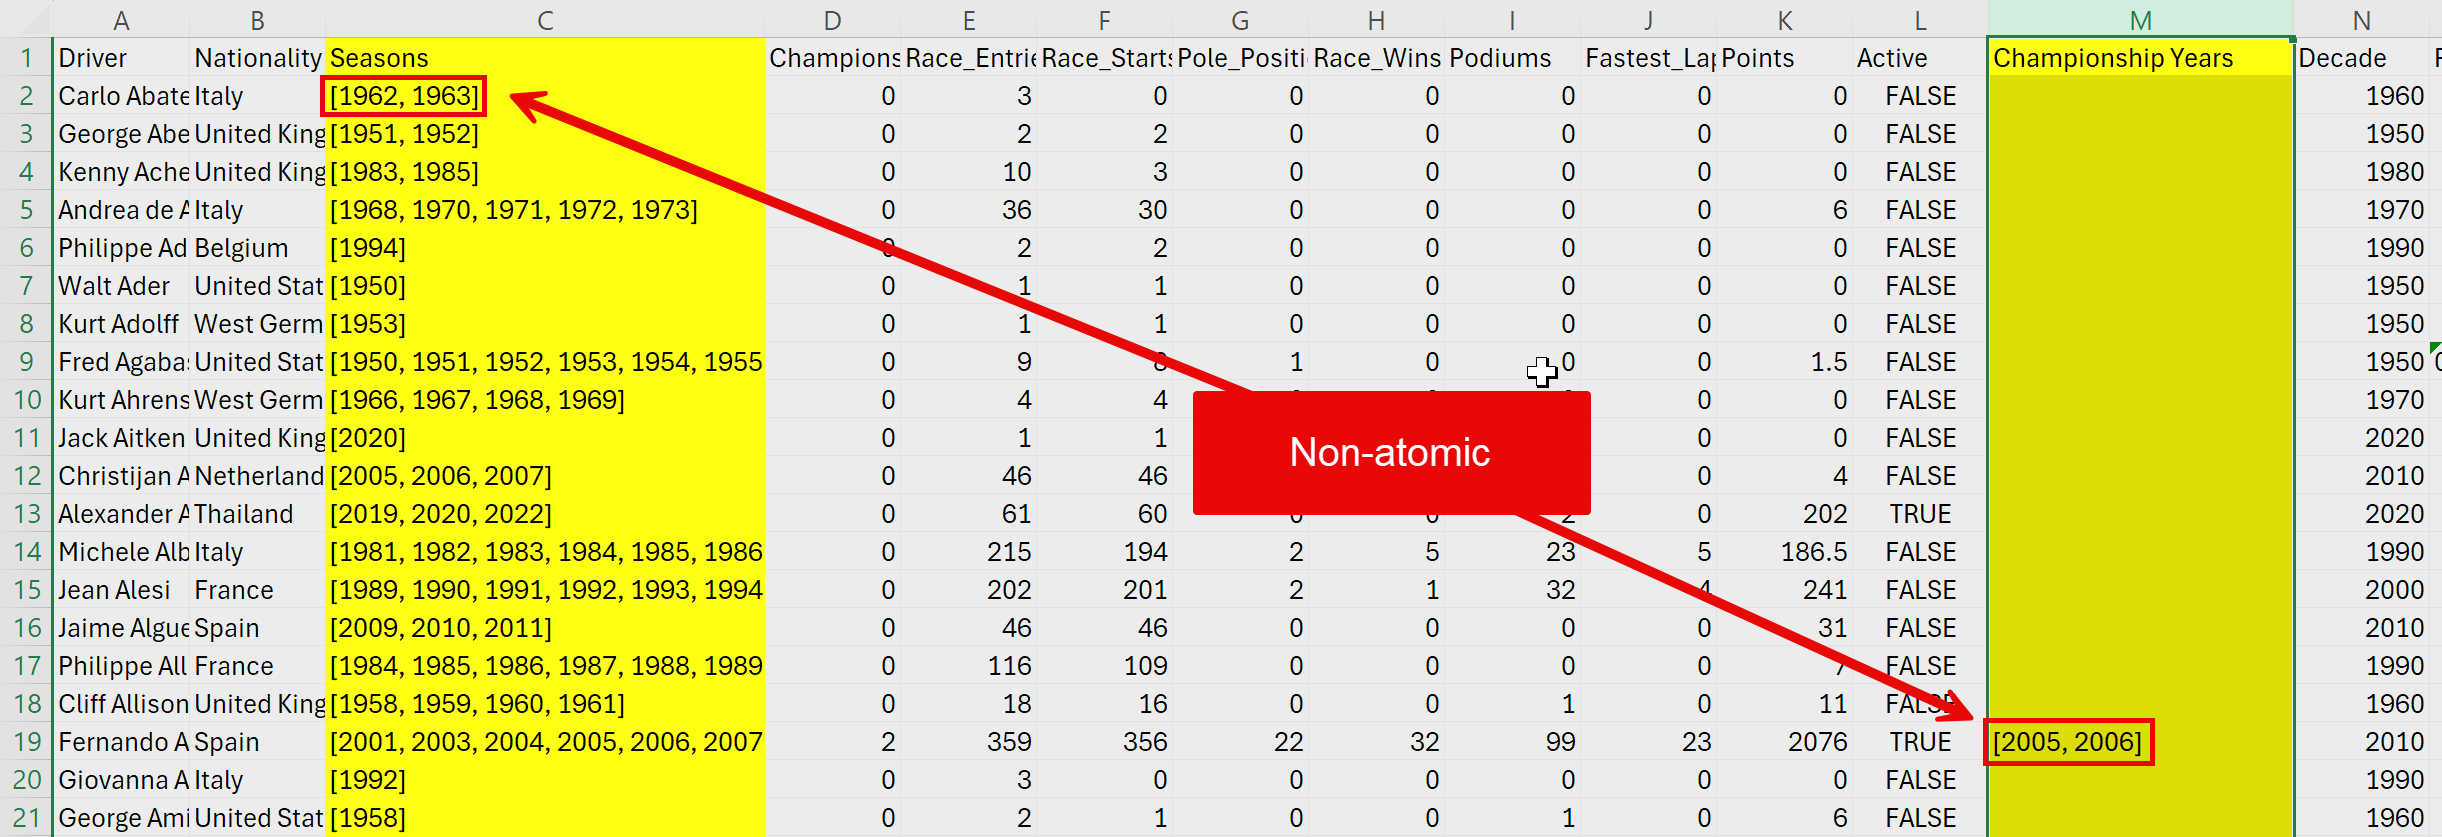
When you find non-atomic values in a column, this means that this column will need to be split into a separate table. Note, that once you have found one non-atomic value in a column, you don’t need to check the rest of that column.
So we can see that we will need to create two tables in addition to the main table, one for Seasons and one for Championship Years.
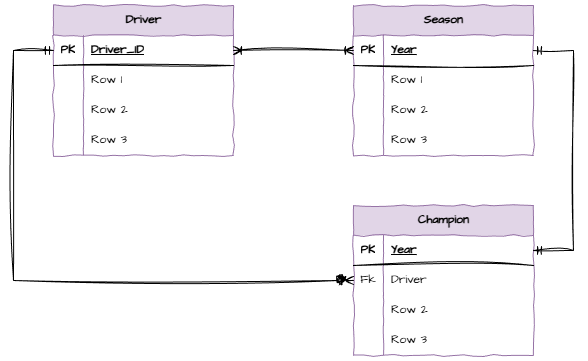
Open Draw.io and use the Entity Relation symbols to create these three tables.
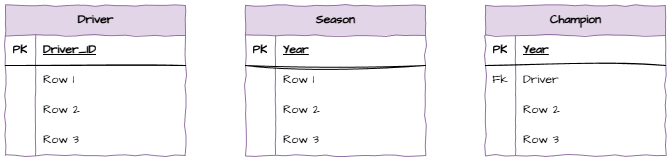
Relationships and Cardinalities
Now add the relationships and cardinalities between the tables.
One driver must have at least one season, but can have many seasons
Each season must have at least one driver, but can have many drivers
One driver can be zero or many champions
Each champion has to be one and only one driver
Each season has to have one and only one champion
Each champion can be in one and only one year
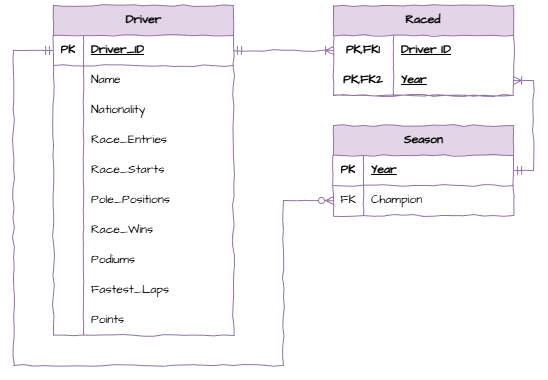
Remove the many-to-many relationship by a bridging entity.
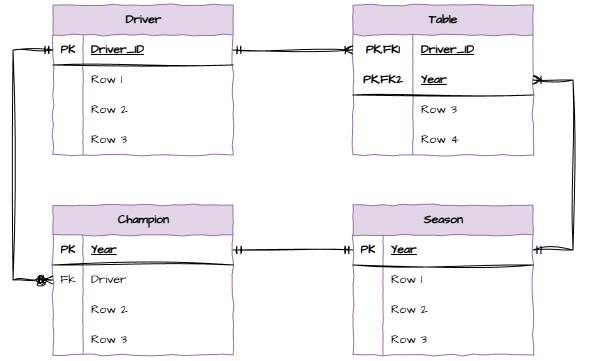
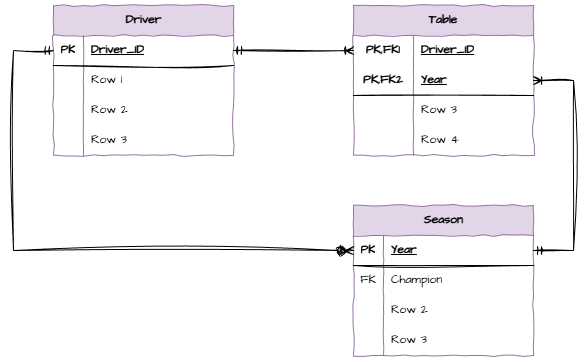
Notice the one-to-one relationship between Seasons and Champions. This means that we can merge these two tables into one.
Partial Dependencies
Next we need to check for partial dependencies. Particial dependencies can only occur in tables with composite primary keys. We only have one table with a composite primary key, the Raced table. Since there are no columns in this table that are not part of the primary key, there are no partial dependencies.
If there were partial dependencies, we would need to create new tables to remove them.
Transitive Dependencies
Finally we need to check for transitive dependencies. A transitive dependency occurs when a non-key attribute depends on another non-key attribute.
If we look back at our csv files we will see many columns that can be inferred from other columns. For example, the Pole Rate can be inferred from the Pole_Positions column and the Race_Entries column. This means that the Pole Rate column depends on the Pole_Positions and Race_Entries columns. Therefore it is transitive.
There are many other columns that are also transitive, so we will not include them in our schema.
Final ERD
We will now include the remaining columns in our schema and end up with the final ERD below.
From here, you need to follow the Relational Schema and Sample Tables as above.
ERD from datafiles activities
Use the netflix_titles.csv file to create an ERD and Relational Schema.